Reporting
Logs
The logs page shows the last 50 transactions in descending time order.
If a row is highlighted in Red, the transaction was rejected, in Yellow, the transaction was deferred and no highlighting means the message was accepted.
Note
Connections that do not create a transaction are not recorded. This means they must at least reach the SMTP MAIL command. This is to prevent hosts hitting rate-limits or IREJECT blacklist entries from filling the logs display.
You can still find these in the UNIX syslog on each worker in /var/log/maillog.
The number of transactions found and the number of pages is also shown, previous and next page buttons are shown allowing you to page through the results.
You can click on a result to take you to the message detail. This will show all the detailed information for the message, who it was sent by, if it used transport layer security, who it was sent to and where the message was delivered to for each recipient along with the headerinformation Sender, From, Reply-To, Subject, Message ID, Size and the overall status.
If the message contained any attachments, then each is displayed along with their type and an md5 hash which allows you to check each with an online service like VirusTotal.
You can also view all of the message headers and see all of the detailed test results.
Log Search
The search input box can be used to search for messages and offers a search engine style free-text lookup where the input is broken into terms (a term is a single word).
All search terms are treated as optional, as long as one term matches a result will be returned.
Multiple words can be treated as a single term that must appear in the same order by surrounding them with double-quotes. You can prefix a search term with + to specify the term must be present and - to specify that it must not be present. Wildcards can be used within a term, ? to replace a single character or * to replace zero or more characters.
You can use AND, OR and NOT and you can group terms and operators together using parentheses.
Quote terms in parenthesis to search as a single term that must appear in the same order.
You can prefix the field name in front of any search term e.g. field:term to limit the result to only where the search term matches a given field.
Without a field prefix, terms are checked automatically across all of the following fields:
| Attribute | Field Name | Notes |
|---|---|---|
| Transaction ID | uuid | To match all of the transaction in a single connection, replace the .\<txn num> at the end of the UUID with a * (e.g. \<connection id>*) |
| IP address | remote_ip | |
| rDNS Hostname | remote_host | |
| Sender Address | sender | |
| Sender Domain | sender_domain | |
| Recipient | rcpt | |
| Recipient Domain | rcpt_domain | |
| Sender Header Address | h_sender | |
| From Header Address | h_from | |
| Reply-To Header Address | h_replyto | |
| Message-ID Header | mid | This field includes the \<>'s surrounding the message ID so you must enclose the wholte Message ID in quotes e.g. "<msgid>" |
Log Report Files
For Admin users, it is possible to generate a cummulative JSON report file corresponding to a search in the Logviewer.
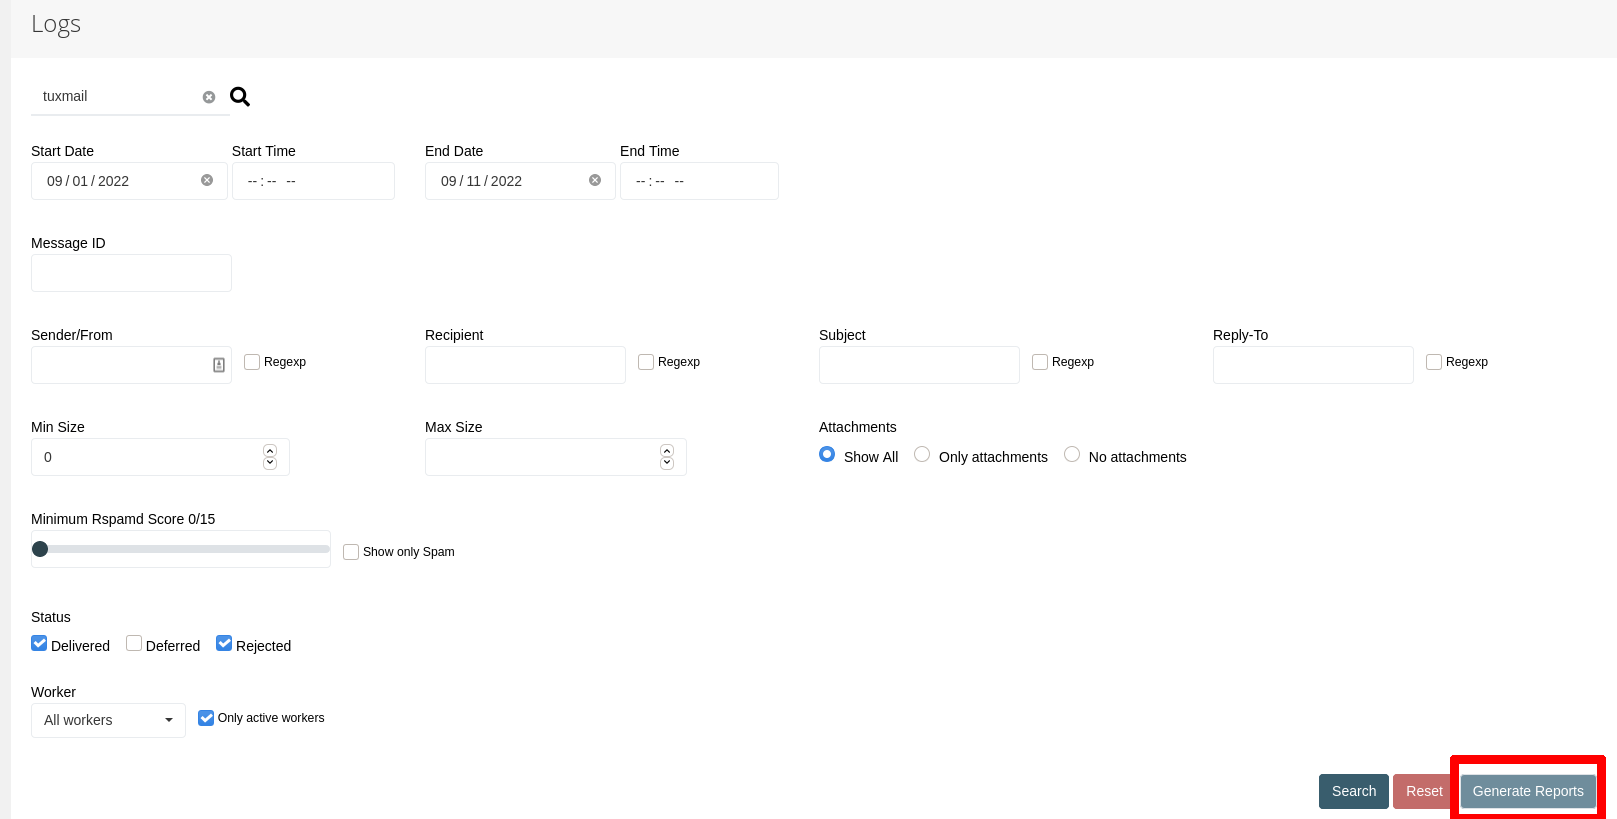
After entering the desired filter arguments into the Logviewer's search inputs, press the "Generate Report" button:
This will open a confirmation modal, which gives a short recap of applied filter settings:
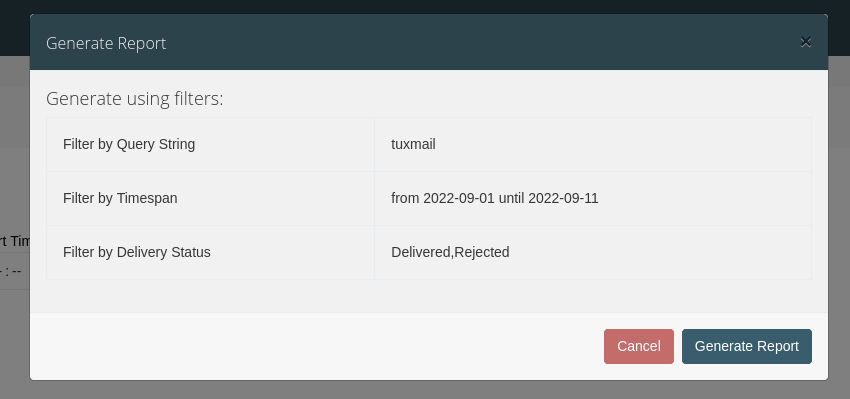
By pressing "Generate Report", the report generation will start in the background.
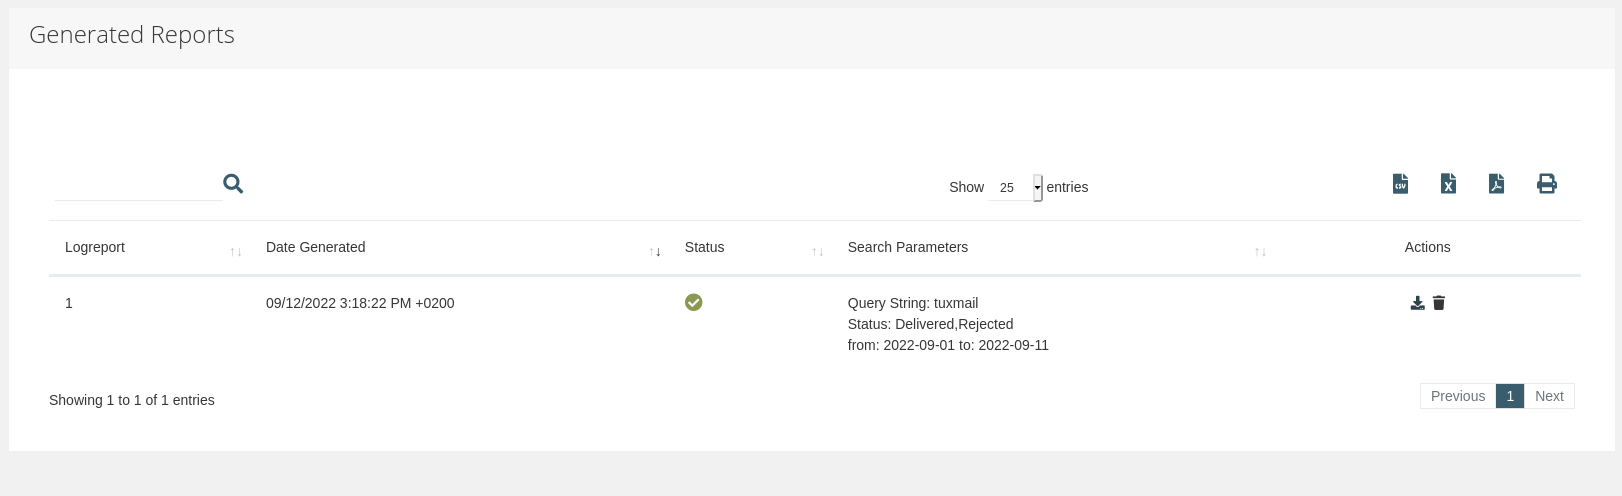
On success, the users's reports page is being loaded automatically via redirect.
This view provides a listing of all available logreports along with the used search params, generator job status and download/delete actions.
Note
In case a logreport has been requested and the view with the modal is exited before the process has terminated, the current status can still be viewed in the user's reports view. The process will therefore continue to run in the background until terminated.
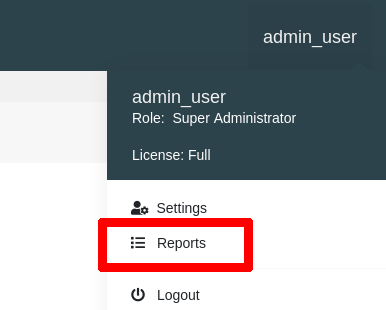
The user reports view can be also accessed via the username context menu on the top right of the GUI:
Cluster
The cluster page shows all of the active worker nodes in a TUXGUARD Mail Gateway cluster.
The graph shows the number of connections for each cluster member over the last 7 days.
You can use the slider to increase or decrease the time displayed on the graph.
The table underneath the graph shows each node and provided the SMTP service is running it will display the key metrics for that node. CPU, Memory, Swap, Disk and Inode usage are shown.
The data on this page is updated automatically every 10 seconds
Filterlist Statistics
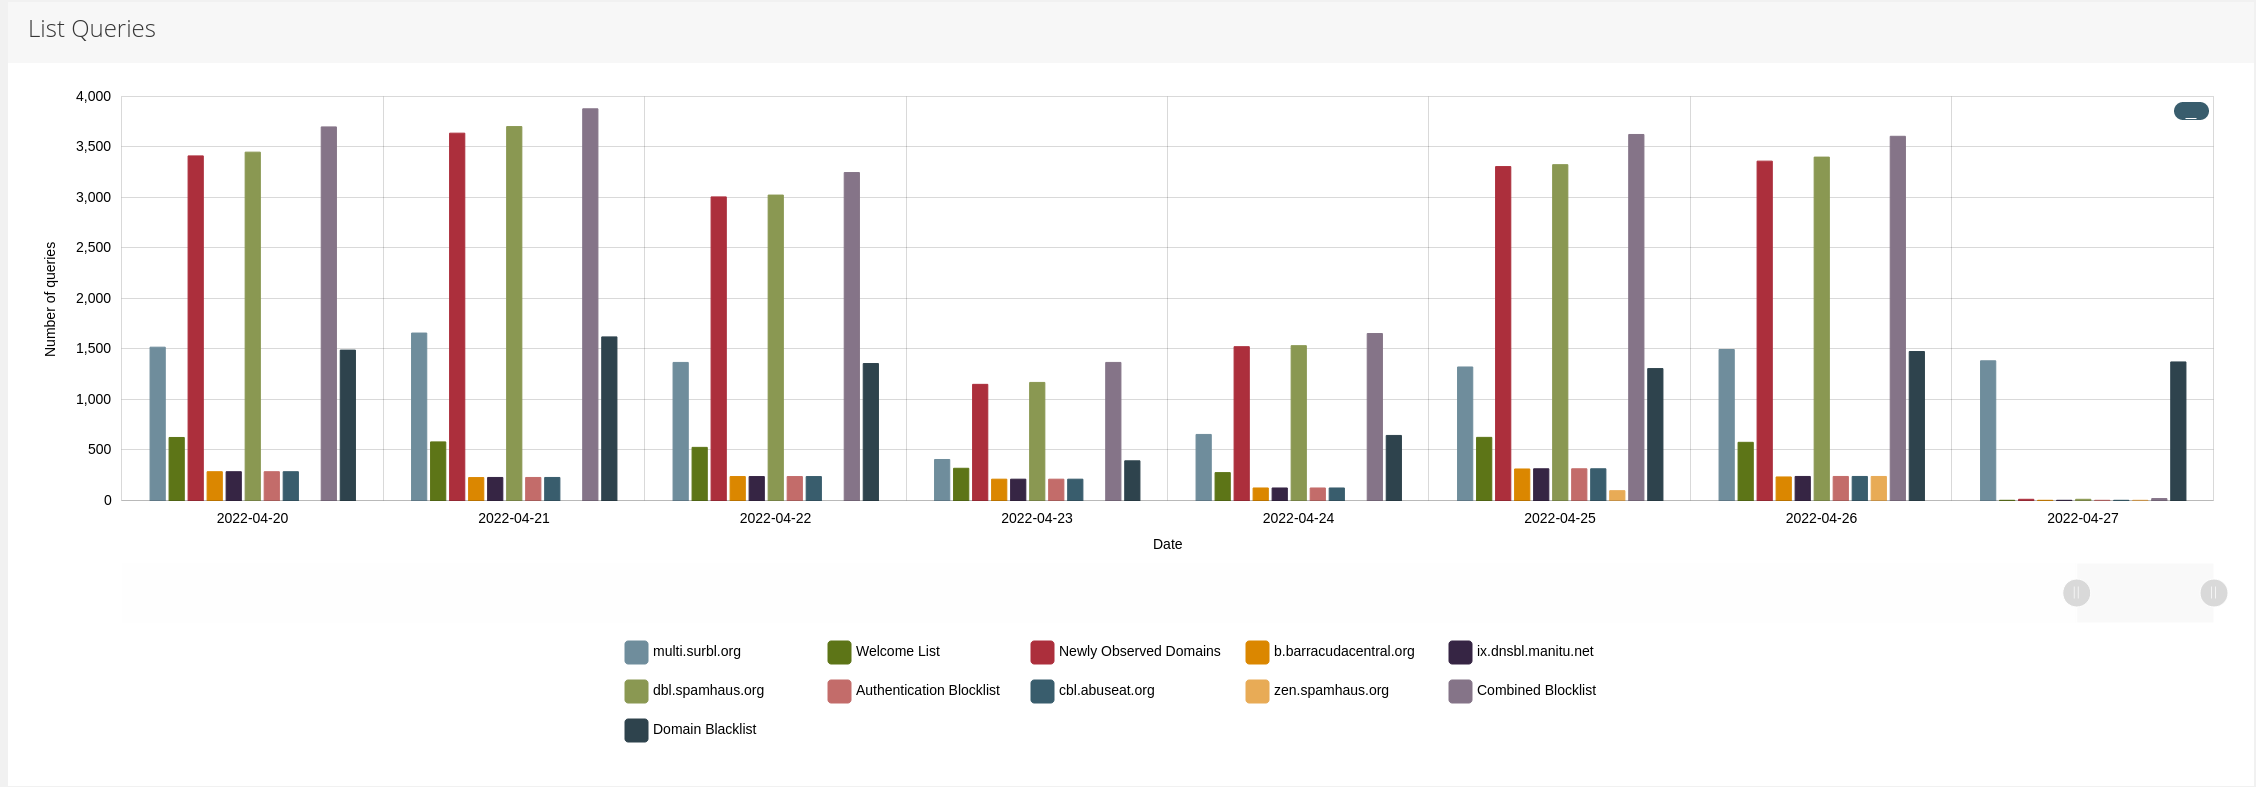
This page provides an overview over the number of queries to DNS lists.
List query numbers by day can be viewed in the zoomable top graph, by default it will zoom in on the last available week.
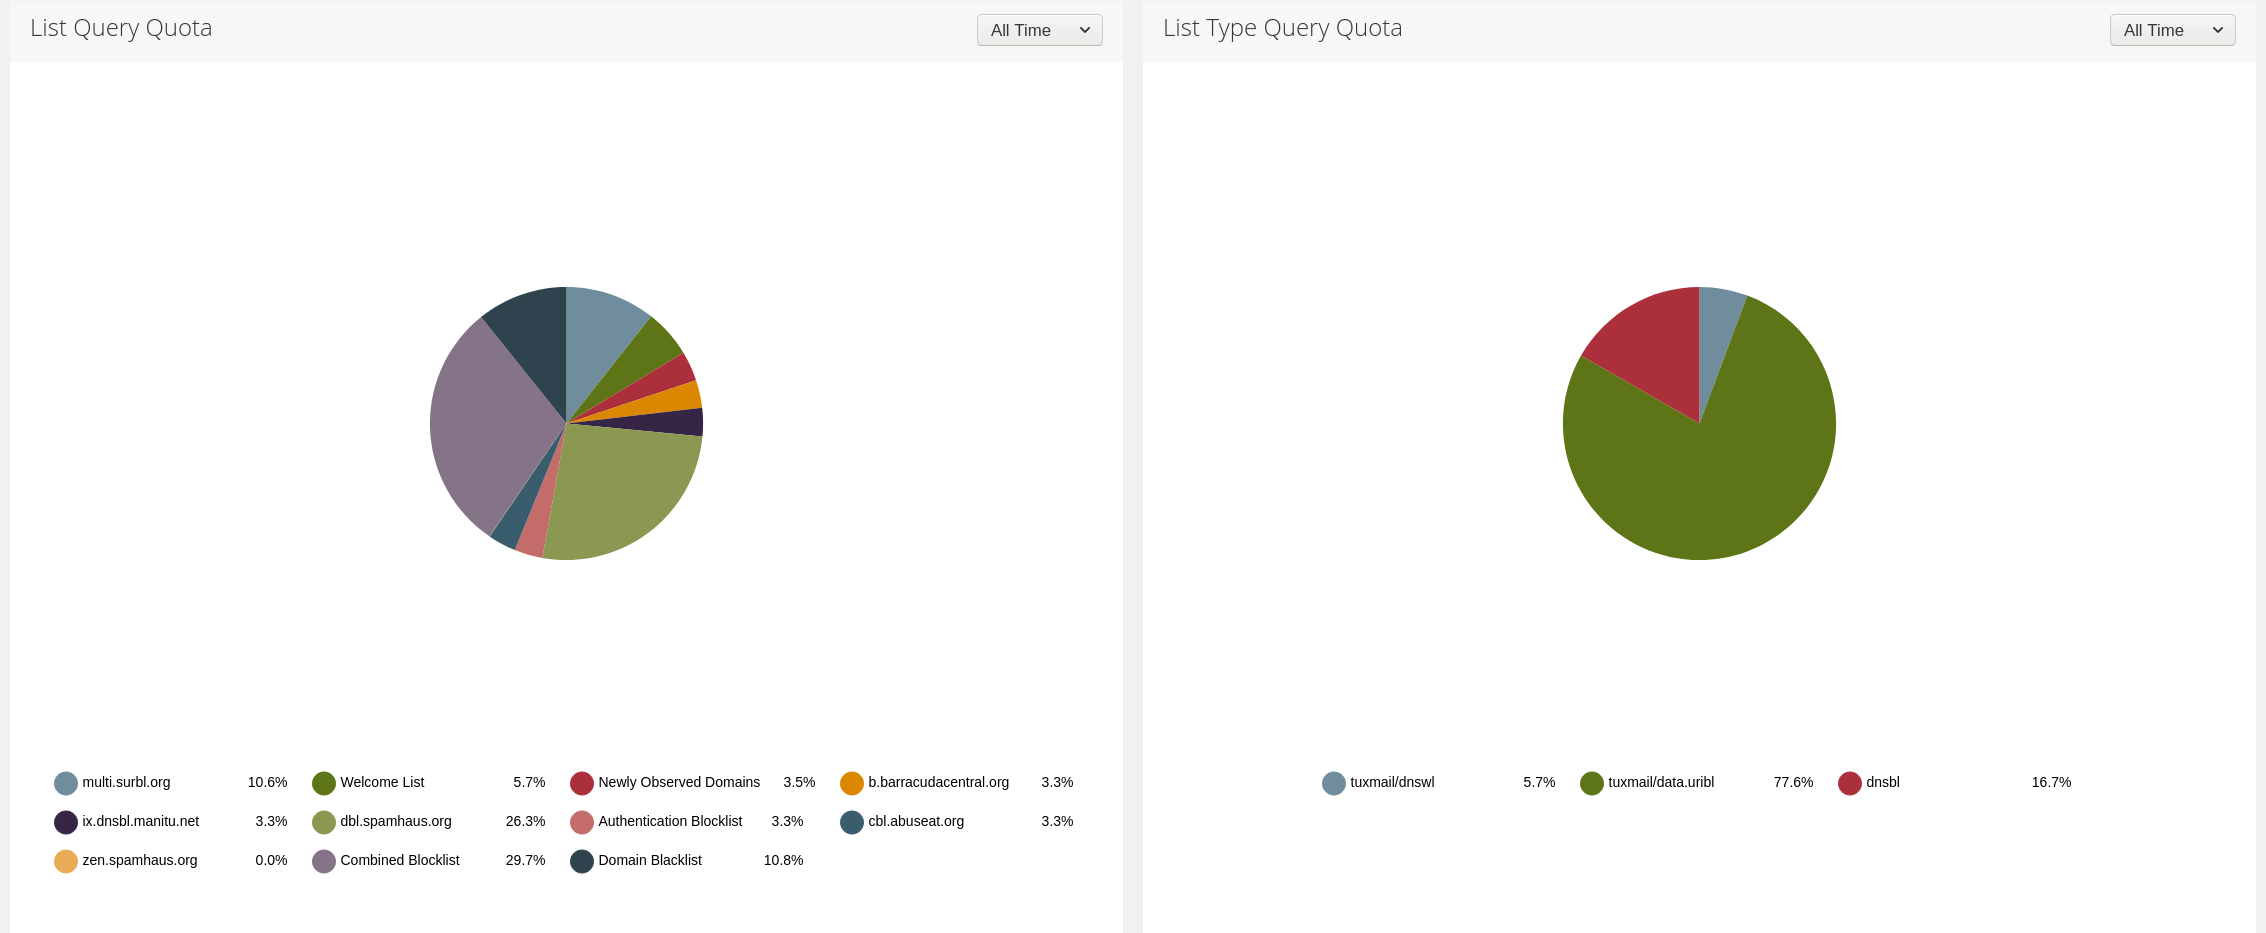
An proportional overview over list query numbers can be seen in the piechart widgets in the middle of the page.
The displayed data can be filtered using the top right dropdown to display data from today, yesterday, last week, last month or alltime (default).
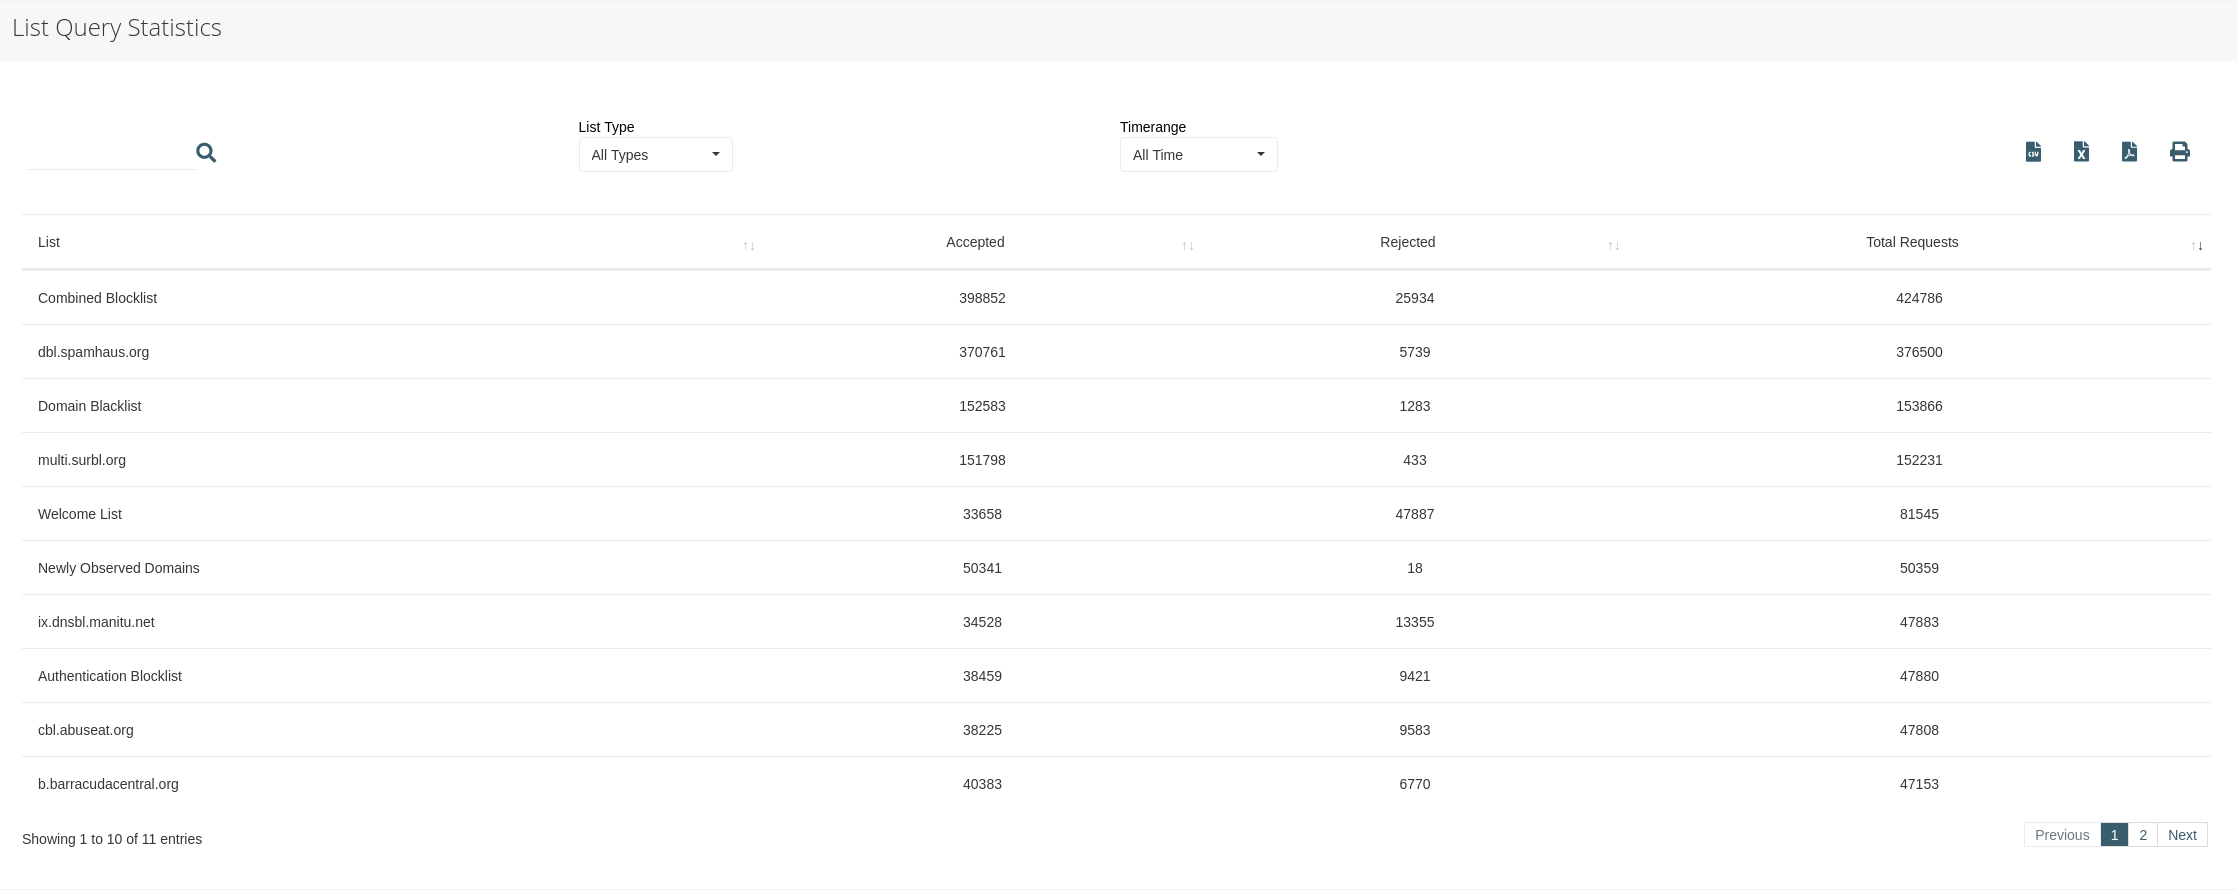
An overview over accepted, rejected and total number of queries is provided by the table at the bottom of the page. Again, this can be filtered by timeframe and also by query list type.
The displayed data will be collected and updated automatically if the autocollect task has been enabled in the configuration page.
The data can be updated on-demand by pressing the "Refresh Statistics" button and selecting the desired timeframe to collect from in the dropdown.
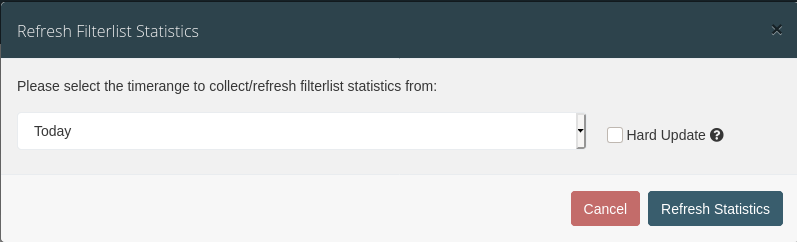
The "hard refresh" checkbox will force overwriting existing data for each day i.e. if not checked, dates where there already is data present will not be overwritten with newly found data.
Note
This task can take some time to complete, especially when selecting the "All time" option.
It is not possible to start another collection task if there is already one running on the system (an error message will appear in this case).
After a successful refresh, the modal will autoclose and the page will be reloaded.
License
The license page allows you to apply a new license or view the current license, which shows the maximum number of domains permitted, the license type and which machines the software is licensed to and when the license expires. After installing a new TUXGUARD Mail Gateway license you must restart the tuxmail-web.service for the new license to be read.
Login to the system as root and run:
systemctl restart tuxmail-web.service